What the latest Property118 survey results means for mortgage lenders: fewer landlords, different behaviour
 admin
admin 

Property118

What the latest Property118 survey results means for mortgage lenders: fewer landlords, different behaviour
For lenders operating in the buy-to-let market, the most important shift is not interest rates or product design; it is behaviour.
The landlord base is no longer acting in the same way it did even a few years ago. Growth is no longer the default, expansion is no longer assumed and in many cases, it is no longer even the objective.
That changes the nature of demand. Historically, lending activity was driven by acquisition and refinancing cycles. Landlords borrowed to grow, then refinanced to release equity and repeat the process. Volume followed momentum but that momentum is now softening. A growing number of landlords are holding rather than expanding, or reducing exposure altogether. When that happens, demand for borrowing changes. It becomes more selective, more strategic and less volume-driven.
This creates a different lending environment. Rather than a broad base of borrowers seeking to expand, lenders are increasingly dealing with experienced landlords who are refining their portfolios. Conversations shift from “how much can I borrow?” to “what structure best supports my position?”.
That distinction matters becaue it suggests that future lending demand may be shaped less by expansion and more by optimisation.
Evidence of this shift can be seen in the Property118 Landlord Sentiment Survey Q1 2026, where a majority of landlords indicate an intention to reduce or hold, rather than grow.
For lenders, the implication is clear: The opportunity does not disappear, but it changes form.
Product design, underwriting and broker relationships may need to adapt to a market where landlords are not chasing scale, but seeking flexibility, efficiency and long-term alignment.
For now, one conclusion stands out: the future of buy-to-let lending will be shaped less by how landlords grow, and more by how they choose to manage what they already have.
For many landlords, the question is not whether the market is changing, but what that change means for their own position.
If you are holding a portfolio with relatively low borrowing, or are beginning to reassess how your assets are structured, this is often the point where a more joined-up view becomes useful.
An invitation for established landlords
If you find the Property118 articles helpful and are curious about how those ideas apply to your own portfolio, you are welcome to take the conversation a step further.
These conversations are typically most useful for landlords with established portfolios and relatively modest borrowing who are beginning to reflect on how their assets could work more effectively in the years ahead.
/* “function”==typeof InitializeEditor,callIfLoaded:function(o){return!(!gform.domLoaded||!gform.scriptsLoaded||!gform.themeScriptsLoaded&&!gform.isFormEditor()||(gform.isFormEditor()&&console.warn(“The use of gform.initializeOnLoaded() is deprecated in the form editor context and will be removed in Gravity Forms 3.1.”),o(),0))},initializeOnLoaded:function(o){gform.callIfLoaded(o)||(document.addEventListener(“gform_main_scripts_loaded”,()=>{gform.scriptsLoaded=!0,gform.callIfLoaded(o)}),document.addEventListener(“gform/theme/scripts_loaded”,()=>{gform.themeScriptsLoaded=!0,gform.callIfLoaded(o)}),window.addEventListener(“DOMContentLoaded”,()=>{gform.domLoaded=!0,gform.callIfLoaded(o)}))},hooks:{action:{},filter:{}},addAction:function(o,r,e,t){gform.addHook(“action”,o,r,e,t)},addFilter:function(o,r,e,t){gform.addHook(“filter”,o,r,e,t)},doAction:function(o){gform.doHook(“action”,o,arguments)},applyFilters:function(o){return gform.doHook(“filter”,o,arguments)},removeAction:function(o,r){gform.removeHook(“action”,o,r)},removeFilter:function(o,r,e){gform.removeHook(“filter”,o,r,e)},addHook:function(o,r,e,t,n){null==gform.hooks[o][r]&&(gform.hooks[o][r]=[]);var d=gform.hooks[o][r];null==n&&(n=r+”_”+d.length),gform.hooks[o][r].push({tag:n,callable:e,priority:t=null==t?10:t})},doHook:function(r,o,e){var t;if(e=Array.prototype.slice.call(e,1),null!=gform.hooks[r][o]&&((o=gform.hooks[r][o]).sort(function(o,r){return o.priority-r.priority}),o.forEach(function(o){“function”!=typeof(t=o.callable)&&(t=window[t]),”action”==r?t.apply(null,e):e[0]=t.apply(null,e)})),”filter”==r)return e[0]},removeHook:function(o,r,t,n){var e;null!=gform.hooks[o][r]&&(e=(e=gform.hooks[o][r]).filter(function(o,r,e){return!!(null!=n&&n!=o.tag||null!=t&&t!=o.priority)}),gform.hooks[o][r]=e)}});
/* ]]> */
Enquire about a free initial discussion with a Property118 consultant
-
Mr.Mrs.MissMs.Dr.Prof.Rev.
-
-
 Important Notice – Scope of Planning Support
Where our recommendations touch on areas requiring regulated input, we refer clients to appropriately authorised professionals for advice and implementation.
-
-
-
/* = 0;if(!is_postback){return;}var form_content = jQuery(this).contents().find(‘#gform_wrapper_585′);var is_confirmation = jQuery(this).contents().find(‘#gform_confirmation_wrapper_585′).length > 0;var is_redirect = contents.indexOf(‘gformRedirect(){‘) >= 0;var is_form = form_content.length > 0 && ! is_redirect && ! is_confirmation;var mt = parseInt(jQuery(‘html’).css(‘margin-top’), 10) + parseInt(jQuery(‘body’).css(‘margin-top’), 10) + 100;if(is_form){jQuery(‘#gform_wrapper_585′).html(form_content.html());if(form_content.hasClass(‘gform_validation_error’)){jQuery(‘#gform_wrapper_585′).addClass(‘gform_validation_error’);} else {jQuery(‘#gform_wrapper_585′).removeClass(‘gform_validation_error’);}setTimeout( function() { /* delay the scroll by 50 milliseconds to fix a bug in chrome */ }, 50 );if(window[‘gformInitDatepicker’]) {gformInitDatepicker();}if(window[‘gformInitPriceFields’]) {gformInitPriceFields();}var current_page = jQuery(‘#gform_source_page_number_585′).val();gformInitSpinner( 585, ‘https://www.property118.com/wp-content/plugins/gravityforms/images/spinner.svg’, true );jQuery(document).trigger(‘gform_page_loaded’, [585, current_page]);window[‘gf_submitting_585′] = false;}else if(!is_redirect){var confirmation_content = jQuery(this).contents().find(‘.GF_AJAX_POSTBACK’).html();if(!confirmation_content){confirmation_content = contents;}jQuery(‘#gform_wrapper_585′).replaceWith(confirmation_content);jQuery(document).trigger(‘gform_confirmation_loaded’, [585]);window[‘gf_submitting_585′] = false;wp.a11y.speak(jQuery(‘#gform_confirmation_message_585′).text());}else{jQuery(‘#gform_585′).append(contents);if(window[‘gformRedirect’]) {gformRedirect();}}jQuery(document).trigger(“gform_pre_post_render”, [{ formId: “585”, currentPage: “current_page”, abort: function() { this.preventDefault(); } }]); if (event && event.defaultPrevented) { return; } const gformWrapperDiv = document.getElementById( “gform_wrapper_585″ ); if ( gformWrapperDiv ) { const visibilitySpan = document.createElement( “span” ); visibilitySpan.id = “gform_visibility_test_585″; gformWrapperDiv.insertAdjacentElement( “afterend”, visibilitySpan ); } const visibilityTestDiv = document.getElementById( “gform_visibility_test_585″ ); let postRenderFired = false; function triggerPostRender() { if ( postRenderFired ) { return; } postRenderFired = true; gform.core.triggerPostRenderEvents( 585, current_page ); if ( visibilityTestDiv ) { visibilityTestDiv.parentNode.removeChild( visibilityTestDiv ); } } function debounce( func, wait, immediate ) { var timeout; return function() { var context = this, args = arguments; var later = function() { timeout = null; if ( !immediate ) func.apply( context, args ); }; var callNow = immediate && !timeout; clearTimeout( timeout ); timeout = setTimeout( later, wait ); if ( callNow ) func.apply( context, args ); }; } const debouncedTriggerPostRender = debounce( function() { triggerPostRender(); }, 200 ); if ( visibilityTestDiv && visibilityTestDiv.offsetParent === null ) { const observer = new MutationObserver( ( mutations ) => { mutations.forEach( ( mutation ) => { if ( mutation.type === ‘attributes’ && visibilityTestDiv.offsetParent !== null ) { debouncedTriggerPostRender(); observer.disconnect(); } }); }); observer.observe( document.body, { attributes: true, childList: false, subtree: true, attributeFilter: [ ‘style’, ‘class’ ], }); } else { triggerPostRender(); } } );} );
/* ]]> */
From there we can arrange a free introductory discussion to explore how your portfolio works as a whole and what that might mean for the years ahead.
|
★★★★★
|
Help other landlords find Property118If you have found Property118 useful, a short Trustpilot review would make a meaningful difference. It helps other landlords decide whether our research is worth following. |


The post What the latest Property118 survey results means for mortgage lenders: fewer landlords, different behaviour appeared first on Property118.
View Full Article: What the latest Property118 survey results means for mortgage lenders: fewer landlords, different behaviour
East London boroughs top decade of house price growth
Property118

East London boroughs top decade of house price growth
East London boroughs have delivered the strongest long-term house price growth in the capital over the past decade, with Redbridge, Havering and Barking and Dagenham leading on annual gains.
Foxtons has analysed government data to find that average house prices across London have increased by around 1.4% a year over the last 10 years.
However, performance differs markedly between boroughs with Redbridge topping the table, with annual growth of 3.6%.
Havering and Barking and Dagenham follow close behind, each posting yearly increases of between 3.1% and 3.3% across the same period.
London house prices
The firm’s managing director of sales, James Stevenson, said: “London has always been a long-term investment story.
“While year-on-year house price performance may fluctuate, it’s this long-term consistency that makes London one of the most resilient and attractive global property markets, notably during periods of global uncertainty.”
He added: “Havering, Bexley and Barking and Dagenham’s performance, in particular, highlights how demand, affordability and lifestyle factors continue to shape the market beyond the traditional prime areas of the capital and, we expect London house prices to continue to post positive growth over the coming years.”
Average London house price
Foxton’s also found that Bexley recorded annual growth of 3.1%.
Sutton and Waltham Forest sit just behind, both seeing prices rise by an average of 2.7% a year.
Further down, Bromley and Greenwich registered annual gains of 2.4% and 2.2%. Lewisham and Enfield follow, each delivering average yearly growth of 2.1%.
Across the capital, the data shows consistent price increases over the decade, despite movements seen through 2025 and into early 2026.
The agency’s analysis also puts average annual house price growth at 1.3% when measured across all boroughs, pointing to steady movement in values over the longer term.
The post East London boroughs top decade of house price growth appeared first on Property118.
View Full Article: East London boroughs top decade of house price growth
Landlords now 8x more likely to reduce portfolios than expand
Property118

Landlords now 8x more likely to reduce portfolios than expand
A clear shift is emerging in the UK private rented sector, and it is not subtle. According to the Property118 Landlord Sentiment Survey Q1 2026, landlords are now significantly more likely to reduce their portfolios than grow them, pointing to a structural change in the direction of the market.
Based on 2,380 completed responses, covering a combined total of 23,098 rental properties, the survey provides one of the most detailed real-time snapshots of landlord behaviour currently available. You can read the full survey results here.
The headline figure is stark: 57% of landlords say they plan to reduce their portfolios over the next 12 months, compared with just 6.8% who intend to expand. That makes landlords more than eight times as likely to sell than to buy.
This is not a marginal imbalance; it is a decisive shift.
A market moving in one direction
At a surface level, the figures might suggest a cooling market, but the reality is more significant. When more than half of landlords are planning to reduce exposure, and fewer than one in fourteen are looking to grow, the direction of travel becomes difficult to ignore. This is not a market in equilibrium; it is a market contracting.
As the survey data published by Property118 shows, these responses were not drawn from a fringe audience. The average respondent owns 9.7 rental properties, which means these are decisions being made by experienced, commercially minded portfolio landlords.
Strategic decisions, not distress
One of the more revealing aspects of the data is what sits behind these decisions. The same Property118 Landlord Sentiment Survey Q1 2026 shows that a significant proportion of landlords are operating with relatively low leverage, with many holding loan-to-value ratios below 50%, and a notable percentage owning properties outright with no borrowing at all. This matters because it suggests that the decision to reduce portfolios is not being driven primarily by financial distress or forced sales. Instead, it points towards a more deliberate, strategic repositioning.
Landlords are choosing to step back.
A signal for policymakers and lenders
The implications extend beyond individual landlords.
A sustained imbalance between sellers and buyers has the potential to reshape supply dynamics across the private rented sector. Fewer landlords expanding means fewer new properties entering the rental market, while increased selling activity may reduce available stock over time, particularly if properties are sold to owner-occupiers.
For lenders, brokers and policymakers, the message is clear: Landlord behaviour is changing, and it is changing in one direction.
The beginning of a trend
This survey represents the first in a planned quarterly series, meaning the figures provide an early indication rather than a one-off anomaly.
If similar patterns emerge in future quarters, the Q1 2026 results may come to be seen as the start of a longer-term structural shift in how landlords engage with the market.
For now, one conclusion stands out: Landlords are not expanding, they are consolidating, repositioning and, in many cases, quietly exiting.
A conversation worth having?
If you are weighing up your own strategy, whether that’s to sell, expand, or restructure to improve profitibility, it is worth having a discussion with a Property118 consultant to take a closer look at how your portfolio is structured as a whole now, and to forecast the outcomes based on multiple scenario’s.
These conversations are typically most useful for landlords with established portfolios and relatively modest borrowing who are beginning to reflect on how their assets could work more effectively in the years ahead.
/* “function”==typeof InitializeEditor,callIfLoaded:function(o){return!(!gform.domLoaded||!gform.scriptsLoaded||!gform.themeScriptsLoaded&&!gform.isFormEditor()||(gform.isFormEditor()&&console.warn(“The use of gform.initializeOnLoaded() is deprecated in the form editor context and will be removed in Gravity Forms 3.1.”),o(),0))},initializeOnLoaded:function(o){gform.callIfLoaded(o)||(document.addEventListener(“gform_main_scripts_loaded”,()=>{gform.scriptsLoaded=!0,gform.callIfLoaded(o)}),document.addEventListener(“gform/theme/scripts_loaded”,()=>{gform.themeScriptsLoaded=!0,gform.callIfLoaded(o)}),window.addEventListener(“DOMContentLoaded”,()=>{gform.domLoaded=!0,gform.callIfLoaded(o)}))},hooks:{action:{},filter:{}},addAction:function(o,r,e,t){gform.addHook(“action”,o,r,e,t)},addFilter:function(o,r,e,t){gform.addHook(“filter”,o,r,e,t)},doAction:function(o){gform.doHook(“action”,o,arguments)},applyFilters:function(o){return gform.doHook(“filter”,o,arguments)},removeAction:function(o,r){gform.removeHook(“action”,o,r)},removeFilter:function(o,r,e){gform.removeHook(“filter”,o,r,e)},addHook:function(o,r,e,t,n){null==gform.hooks[o][r]&&(gform.hooks[o][r]=[]);var d=gform.hooks[o][r];null==n&&(n=r+”_”+d.length),gform.hooks[o][r].push({tag:n,callable:e,priority:t=null==t?10:t})},doHook:function(r,o,e){var t;if(e=Array.prototype.slice.call(e,1),null!=gform.hooks[r][o]&&((o=gform.hooks[r][o]).sort(function(o,r){return o.priority-r.priority}),o.forEach(function(o){“function”!=typeof(t=o.callable)&&(t=window[t]),”action”==r?t.apply(null,e):e[0]=t.apply(null,e)})),”filter”==r)return e[0]},removeHook:function(o,r,t,n){var e;null!=gform.hooks[o][r]&&(e=(e=gform.hooks[o][r]).filter(function(o,r,e){return!!(null!=n&&n!=o.tag||null!=t&&t!=o.priority)}),gform.hooks[o][r]=e)}});
/* ]]> */
Enquire about a free initial discussion with a Property118 consultant
-
Mr.Mrs.MissMs.Dr.Prof.Rev.
-
-
Important Notice – Scope of Planning Support
Where our recommendations touch on areas requiring regulated input, we refer clients to appropriately authorised professionals for advice and implementation.
-
-
-
/* = 0;if(!is_postback){return;}var form_content = jQuery(this).contents().find(‘#gform_wrapper_585′);var is_confirmation = jQuery(this).contents().find(‘#gform_confirmation_wrapper_585′).length > 0;var is_redirect = contents.indexOf(‘gformRedirect(){‘) >= 0;var is_form = form_content.length > 0 && ! is_redirect && ! is_confirmation;var mt = parseInt(jQuery(‘html’).css(‘margin-top’), 10) + parseInt(jQuery(‘body’).css(‘margin-top’), 10) + 100;if(is_form){jQuery(‘#gform_wrapper_585′).html(form_content.html());if(form_content.hasClass(‘gform_validation_error’)){jQuery(‘#gform_wrapper_585′).addClass(‘gform_validation_error’);} else {jQuery(‘#gform_wrapper_585′).removeClass(‘gform_validation_error’);}setTimeout( function() { /* delay the scroll by 50 milliseconds to fix a bug in chrome */ }, 50 );if(window[‘gformInitDatepicker’]) {gformInitDatepicker();}if(window[‘gformInitPriceFields’]) {gformInitPriceFields();}var current_page = jQuery(‘#gform_source_page_number_585′).val();gformInitSpinner( 585, ‘https://www.property118.com/wp-content/plugins/gravityforms/images/spinner.svg’, true );jQuery(document).trigger(‘gform_page_loaded’, [585, current_page]);window[‘gf_submitting_585′] = false;}else if(!is_redirect){var confirmation_content = jQuery(this).contents().find(‘.GF_AJAX_POSTBACK’).html();if(!confirmation_content){confirmation_content = contents;}jQuery(‘#gform_wrapper_585′).replaceWith(confirmation_content);jQuery(document).trigger(‘gform_confirmation_loaded’, [585]);window[‘gf_submitting_585′] = false;wp.a11y.speak(jQuery(‘#gform_confirmation_message_585′).text());}else{jQuery(‘#gform_585′).append(contents);if(window[‘gformRedirect’]) {gformRedirect();}}jQuery(document).trigger(“gform_pre_post_render”, [{ formId: “585”, currentPage: “current_page”, abort: function() { this.preventDefault(); } }]); if (event && event.defaultPrevented) { return; } const gformWrapperDiv = document.getElementById( “gform_wrapper_585″ ); if ( gformWrapperDiv ) { const visibilitySpan = document.createElement( “span” ); visibilitySpan.id = “gform_visibility_test_585″; gformWrapperDiv.insertAdjacentElement( “afterend”, visibilitySpan ); } const visibilityTestDiv = document.getElementById( “gform_visibility_test_585″ ); let postRenderFired = false; function triggerPostRender() { if ( postRenderFired ) { return; } postRenderFired = true; gform.core.triggerPostRenderEvents( 585, current_page ); if ( visibilityTestDiv ) { visibilityTestDiv.parentNode.removeChild( visibilityTestDiv ); } } function debounce( func, wait, immediate ) { var timeout; return function() { var context = this, args = arguments; var later = function() { timeout = null; if ( !immediate ) func.apply( context, args ); }; var callNow = immediate && !timeout; clearTimeout( timeout ); timeout = setTimeout( later, wait ); if ( callNow ) func.apply( context, args ); }; } const debouncedTriggerPostRender = debounce( function() { triggerPostRender(); }, 200 ); if ( visibilityTestDiv && visibilityTestDiv.offsetParent === null ) { const observer = new MutationObserver( ( mutations ) => { mutations.forEach( ( mutation ) => { if ( mutation.type === ‘attributes’ && visibilityTestDiv.offsetParent !== null ) { debouncedTriggerPostRender(); observer.disconnect(); } }); }); observer.observe( document.body, { attributes: true, childList: false, subtree: true, attributeFilter: [ ‘style’, ‘class’ ], }); } else { triggerPostRender(); } } );} );
/* ]]> */
|
★★★★★
|
Help other landlords find Property118If you have found Property118 useful, a short Trustpilot review would make a meaningful difference. It helps other landlords decide whether our research is worth following. |
The post Landlords now 8x more likely to reduce portfolios than expand appeared first on Property118.
View Full Article: Landlords now 8x more likely to reduce portfolios than expand
83% of housing growth came from private landlords
Property118
83% of housing growth came from private landlords
The overlooked statistic from England’s housing data that could reshape the policy debate.
Housing debates in Britain often start from a familiar assumption; that the growth of the private rented sector reduced housing supply by diverting homes away from first-time buyers, but one statistic tells a very different story.
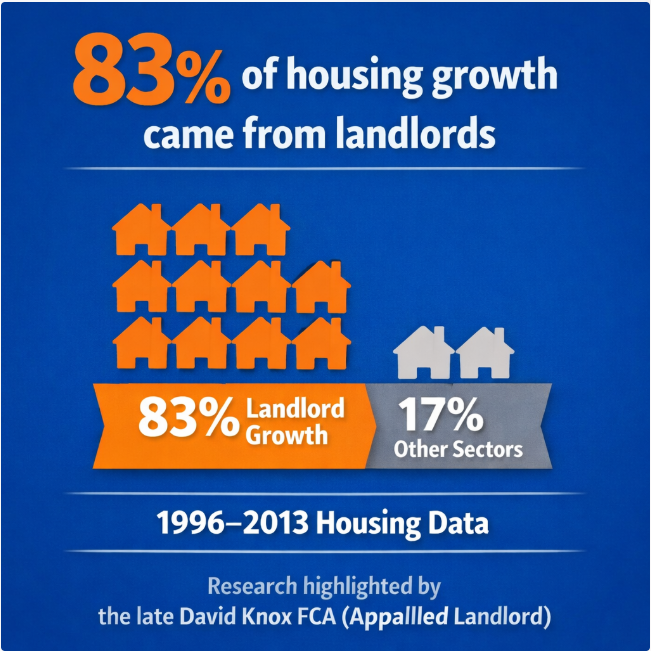
Between 1996 and 2013, the number of dwellings in England increased from 20.3 million to 23.3 million homes, and during that same period the number of privately rented homes rose from around 2.0 million to 4.5 million. In other words, roughly 2.5 million of the additional homes appeared within the private rented sector.
That means the private rented sector accounted for around 83% of the increase in England’s housing stock during that period.
The statistic was highlighted back in 2016 by Property118 contributor David Knox, writing under the pseudonym “Appalled Landlord”, in an open letter to a Member of Parliament.
At the time, it challenged a narrative that was already gaining traction in housing policy debates. Today, it raises a more important question …
If private landlords played such a significant role in expanding housing supply in the past, what role could they play in addressing the housing shortage today?
How the private rented sector expanded so quickly
The growth of the private rented sector during the late 1990s and early 2000s did not happen by accident; several structural changes occurred at the same time.
The introduction of buy-to-let mortgages in the mid-1990s made it easier for individuals to invest in rental property. Financial institutions recognised that rental income could support borrowing, and lenders began offering products specifically designed for landlords. At the same time, demographic changes were increasing demand for rental housing. Labour mobility, rising student numbers and delayed home ownership meant more households were looking for rented accommodation, but demand alone does not increase housing supply.
What changed was the willingness of thousands of small investors to deploy capital into housing. Instead of relying solely on large developers or housing associations, the market suddenly had hundreds of thousands of individual participants willing to finance, renovate and operate rental homes. Many of those investors were not building entirely new homes. They were bringing existing housing stock back into productive use. That process, multiplied across the country, significantly expanded the number of homes available to rent.
The practical ways landlords increased housing supply
The expansion of the private rented sector did not simply involve buying completed homes and letting them out. Landlords often undertook projects that changed the way existing housing stock was used.
One common route was the renovation of empty or neglected properties. Across many towns and cities, landlords purchased houses that had been vacant or poorly maintained and refurbished them for rental use. Those properties that might otherwise have remained empty were returned to the housing market.
Another mechanism was conversion. Large houses were frequently converted into Houses in Multiple Occupation (HMOs), increasing the number of people who could live within the same building. In many urban areas this provided accommodation for students, young professionals and migrant workers who might otherwise have struggled to find housing.
Landlords also played an important role in supporting new developments. Purchasing properties off-plan helped developers secure financing for projects that might otherwise have stalled. Early investor purchases often provided the certainty developers needed to move ahead with construction.
In addition, some landlords converted commercial buildings or subdivided larger properties into smaller units, creating additional dwellings without requiring entirely new construction.
Taken individually, these projects may appear small, but taken together, they represented a significant contribution to housing availability.
This is why the statistics highlighted by David Knox are so striking; they suggest that the expansion of the private rented sector was not simply a shift in tenure. In many cases it involved bringing additional housing into use or increasing the number of households that existing buildings could accommodate.
What changed after the expansion years?
The period between the late 1990s and early 2010s was unusually favourable for investment in the private rented sector. Demand for rental housing was growing, credit was widely available and the regulatory framework was relatively stable. For many investors the economics of rental property were predictable enough to justify long-term commitments.
During the past decade, however, the environment for landlords has changed significantly.
A number of policy reforms were introduced that altered the financial and regulatory landscape of the sector. These included changes to mortgage interest tax relief, higher rates of Stamp Duty Land Tax on additional properties, tighter lending standards for buy-to-let borrowing and the gradual expansion of licensing and regulatory requirements in many local authority areas.
Each of these measures had its own policy objective. Some were introduced to address financial stability concerns, others to raise tax revenue or improve housing standards. but taken together they changed the risk profile of residential property investment.
For many smaller landlords, particularly those using borrowing to finance their investments, the economics became more uncertain. At the same time, rising interest rates and construction costs made property investment more capital intensive. The result has been a noticeable shift in behaviour.
Instead of expanding portfolios, many landlords have slowed investment, paused acquisitions or begun selling properties. At the same time fewer new investors have entered the sector than during the expansion years. None of this means the private rented sector is disappearing; millions of households still rely on it for housing. However, the pace of growth that characterised the earlier period has clearly slowed.
Why investor confidence matters in housing supply
Housing supply is often discussed primarily in terms of planning policy and large-scale development. Those factors are undeniably important; major housing developments require land allocation, infrastructure and the financial capacity of large builders, yet the experience of the private rented sector shows that housing supply can also expand through many smaller investment decisions.
When thousands of individual investors renovate vacant homes, convert properties or support new developments through early purchases, the cumulative effect can be substantial.
The expansion of the private rented sector between 1996 and 2013 illustrates how powerful that distributed investment model can be.
Conversely, when those investors lose confidence in the stability or profitability of the sector, the flow of capital into housing can slow just as quickly.
This dynamic is not unique to housing. In any sector where private capital plays a role, investment tends to follow confidence.
If private landlords once contributed significantly to the expansion of housing supply, what conditions would need to exist for them to do so again?
What would encourage landlords to invest again?
If housing policy is ultimately about increasing the number of homes available to live in, it is reasonable to ask what conditions encourage investment in housing.
The expansion of the private rented sector between 1996 and 2013 did not occur because government instructed landlords to invest. It happened because thousands of individuals concluded that investing in housing was both economically viable and socially acceptable.
Those conditions were not created by a single policy decision, they were the result of several factors working together.
The tax treatment of rental income was broadly aligned with other forms of business investment. Mortgage lending for buy-to-let was accessible but still subject to prudent underwriting. Regulatory requirements existed but changed relatively slowly, allowing investors to plan with some confidence.
Most importantly, the sector operated within a framework that was broadly predictable.
When investment decisions involve assets that may be held for decades, predictability matters. Investors do not require guaranteed returns, but they do need to understand the rules under which they are operating. When the policy environment becomes uncertain or changes frequently, investors tend to pause before committing capital.
The experience of the past decade suggests that investor behaviour in the housing market is no different from other sectors of the economy. When returns become less predictable or risks increase, investment tends to slow. Conversely, when the environment supports stable long-term investment, capital tends to return.
Lessons for housing policy
The purpose of this article is not to suggest that the private rented sector alone can solve Britain’s housing shortage. Housing supply depends on many factors, including planning policy, infrastructure, land availability and the capacity of major housebuilders, but the historical evidence does suggest that private landlords once played a significant role in expanding housing availability.
They did so not through large-scale national programmes, but through thousands of individual decisions to renovate properties, convert buildings and invest in new developments.
If policymakers are searching for ways to increase housing supply, that experience raises a question worth considering; is the current policy environment encouraging or discouraging that kind of distributed investment?
If the goal is to increase the number of homes available to rent or buy, the answer to that question may matter more than is often acknowledged in housing debates.
A simple thought experiment
Imagine the housing market between 1996 and 2013 without the private rented sector.
During that period England added around 3 million homes to its housing stock. Roughly 2.5 million of those appeared within the private rented sector.
Remove that expansion and the housing market would have looked very different.
Many of the renovated properties, converted buildings and investor-backed developments that became rental homes might never have appeared in the housing supply at all. That observation does not solve today’s housing shortage, but it does highlight something worth remembering when policymakers discuss the role of private landlords.
A statistic worth remembering
When David Knox wrote his open letter several years ago, he highlighted a statistic that had received relatively little attention.
During the period between 1996 and 2013, roughly 83% of the increase in England’s housing stock occurred within the private rented sector.
The number itself does not provide a complete explanation of Britain’s housing challenges, but it does remind us of something important. At one point in recent history, private landlords were responsible for a large share of the expansion in available housing. If Britain is searching for ways to increase housing supply again, it may be worth asking why.
Attribution
The statistic referenced in this article was highlighted by Property118 contributor David Knox, who wrote under the pseudonym “Appalled Landlord”.
David passed away in January 2020, but his research into housing policy and landlord economics remains part of the Property118 archive.
His original article can be read here:
Support Property118 and keep the platform independent
If you value evidence-led reporting like this, you can support the work here.
Monthly support helps fund independent reporting, research, and the free landlord forum.
The post 83% of housing growth came from private landlords appeared first on Property118.
View Full Article: 83% of housing growth came from private landlords
Categories
- Landlords (19)
- Real Estate (9)
- Renewables & Green Issues (1)
- Rental Property Investment (1)
- Tenants (21)
- Uncategorized (12,777)
Archives
- June 2026 (54)
- May 2026 (70)
- April 2026 (78)
- March 2026 (72)
- February 2026 (55)
- January 2026 (52)
- December 2025 (62)
- August 2025 (51)
- July 2025 (51)
- June 2025 (49)
- May 2025 (50)
- April 2025 (48)
- March 2025 (54)
- February 2025 (51)
- January 2025 (52)
- December 2024 (55)
- November 2024 (64)
- October 2024 (82)
- September 2024 (69)
- August 2024 (55)
- July 2024 (64)
- June 2024 (54)
- May 2024 (73)
- April 2024 (59)
- March 2024 (49)
- February 2024 (57)
- January 2024 (58)
- December 2023 (56)
- November 2023 (59)
- October 2023 (67)
- September 2023 (136)
- August 2023 (131)
- July 2023 (129)
- June 2023 (128)
- May 2023 (140)
- April 2023 (121)
- March 2023 (168)
- February 2023 (155)
- January 2023 (152)
- December 2022 (136)
- November 2022 (158)
- October 2022 (146)
- September 2022 (148)
- August 2022 (169)
- July 2022 (124)
- June 2022 (124)
- May 2022 (130)
- April 2022 (116)
- March 2022 (155)
- February 2022 (124)
- January 2022 (120)
- December 2021 (117)
- November 2021 (139)
- October 2021 (130)
- September 2021 (138)
- August 2021 (110)
- July 2021 (110)
- June 2021 (60)
- May 2021 (127)
- April 2021 (122)
- March 2021 (156)
- February 2021 (154)
- January 2021 (133)
- December 2020 (126)
- November 2020 (159)
- October 2020 (169)
- September 2020 (181)
- August 2020 (147)
- July 2020 (172)
- June 2020 (158)
- May 2020 (177)
- April 2020 (188)
- March 2020 (234)
- February 2020 (212)
- January 2020 (164)
- December 2019 (107)
- November 2019 (131)
- October 2019 (145)
- September 2019 (123)
- August 2019 (112)
- July 2019 (93)
- June 2019 (82)
- May 2019 (94)
- April 2019 (88)
- March 2019 (78)
- February 2019 (77)
- January 2019 (71)
- December 2018 (37)
- November 2018 (85)
- October 2018 (108)
- September 2018 (110)
- August 2018 (135)
- July 2018 (140)
- June 2018 (118)
- May 2018 (113)
- April 2018 (64)
- March 2018 (96)
- February 2018 (82)
- January 2018 (92)
- December 2017 (62)
- November 2017 (100)
- October 2017 (105)
- September 2017 (97)
- August 2017 (101)
- July 2017 (104)
- June 2017 (155)
- May 2017 (135)
- April 2017 (113)
- March 2017 (138)
- February 2017 (150)
- January 2017 (127)
- December 2016 (90)
- November 2016 (135)
- October 2016 (149)
- September 2016 (135)
- August 2016 (48)
- July 2016 (52)
- June 2016 (54)
- May 2016 (52)
- April 2016 (24)
- October 2014 (8)
- April 2012 (2)
- December 2011 (2)
- November 2011 (10)
- October 2011 (9)
- September 2011 (9)
- August 2011 (3)
Calendar
Recent Posts
- Could Andy Burnham’s proposed land tax force landlords to sell?
- Buy to let lenders widen landlord options
- What the World Cup teaches landlords about selling property
- The Mortgage Works to pilot landlord EPC support package
- Landbay, Kensington and Dudley cut landlord BTL mortgage rates